
explainer
Standard curves that bend
Why immunoassay standard curves are sigmoid, where the usable window sits, and what an early bend or a forced straight line does to a reported value.
- Author
- EVRINTH Editorial Team
- Published
- 8 October 2026
- Updated
- 8 October 2026
- Reading time
- 9 min
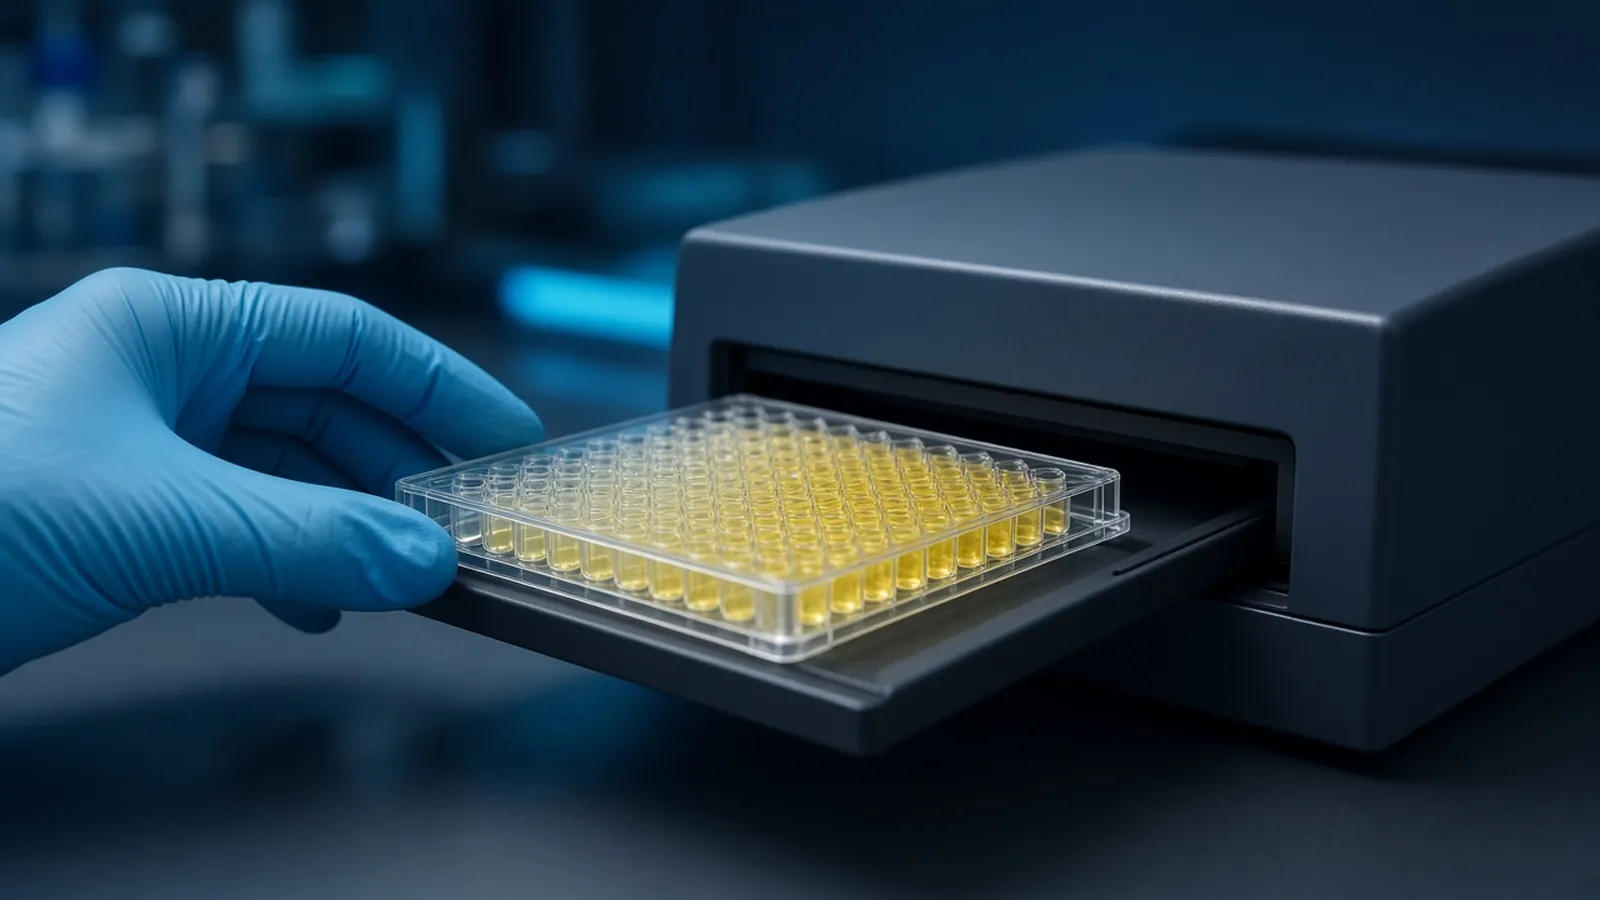
A standard curve that bends is what an immunoassay usually owes you. Antibody binding saturates. Enzyme rate saturates. The reader saturates. The plot of signal against concentration is therefore a sigmoid far more often than a ruler-straight line, and the only concentrations worth quoting sit on the steep middle. Forcing a straight line through that bend invents numbers at both ends. The format and the blanks that make a curve interpretable are set out in ELISA formats, controls and readout. This page is about the shape itself, on a research plate.
Who is looking at the plot, and what decision it supports
You are here if the software drew a curve and you have to decide whether to report the interpolated concentrations or to dilute and repeat. A sample whose signal sits on the steep limb can be reported, with the fit you locked before you looked at outliers. A sample on the shoulder cannot be rescued by a more confident font. Dilute it, concentrate it, or call it out of range.
A research curve compares the wells you prepared. It does not assign a medical meaning to a concentration.
Why the chemistry draws a sigmoid
At very low analyte the capture sites are mostly empty and the signal sits near the background of blocked plastic, leftover enzyme and substrate colour. As analyte increases, more sandwiches or more displacement events form, and signal changes quickly. At high analyte the capture antibody, the detection antibody or the enzyme substrate is used up. Extra analyte then changes the signal very little. Competitive assays draw the same S flipped: the zero is high, and the curve falls toward a bottom asymptote as analyte displaces the competitor.
A four-parameter logistic is a compact description of that shape. One parameter is the lower asymptote, one is the upper, one is the concentration at the inflection, and one is the steepness. Some groups add a fifth parameter when the curve is visibly asymmetric. Choose the fit because the points require it, and write the choice in the notebook before you interpret a surprising sample. Public notes on curve practice turn up in laboratory collections such as protocols.io. Measurement institutes such as NIST are a reminder that a fitted number still needs a stated procedure. They are not a certificate for your plate.
The useful window is the steep middle, where a small change in signal maps to a modest change in concentration. On the flat top and the flat bottom the derivative is near zero. A tiny pipetting wobble, a bubble, or a fingerprint on the plate bottom moves the reported concentration by a large factor. That is why duplicates which "look close" in absorbance at the plateau are not close enough to publish.
What an early bend is trying to tell you
A healthy sigmoid bends because of saturation, and it bends at the top standard you planned. A curve that flattens after the second or third standard, while several calibrators are piled on the same absorbance, has run out of something else.
Hook effect is the first suspect in a one-step sandwich. Very high calibrator can occupy capture and detection antibodies on different molecules so the sandwich never forms, and the top points fall instead of flattening. Dilution of those points should raise the signal back onto the limb. If it does, you do not have a low calibrator. You have a calibrator past the assay. The dilute-to-check logic is the right next experiment.
Depleted substrate is the second suspect. Horseradish peroxidase with a colour substrate such as a tetramethylbenzidine class will stop producing new colour once the substrate is exhausted, even if enzyme is still bound. The top of the curve flattens and, if you wait too long, the bottom rises as well because every well crawls toward the same spent colour. Follow the minutes and the stop reagent the substrate protocol names. Promega protocols are one public place reagent makers describe that timing. Use the sheet that belongs to the bottle you opened.
Reader saturation is the third. Absorbance photometers are not linear without limit. Many colour plates are designed to be read near 450 nanometres after an acid stop, and many instruments become unreliable as absorbance climbs toward the top of their stated range. If every high well reports the same ceiling value, you developed too far or the pathlength and the wavelength are wrong. A fluorescence read saturates for a different reason: the detector, or the inner filter effect in a concentrated well. Dilute the colour or shorten development. Do not subtract your way out of a ceiling.
The fourth suspect is the matrix of the standards. A calibrator diluted in buffer can bend in a different place from the same calibrator diluted in serum, lysate or culture medium. The curve is then a description of the buffer, and samples in the real matrix are being read off the wrong shape. Spike the calibrator into the sample matrix and ask whether the curve moves. Identity of the protein you think you diluted is a sequence question. A record such as NCBI Protein is where you confirm the accession, not where the plate is validated.
How to back-calculate without inventing a line
Plot signal against log concentration if that is how your fit is parameterised, and look at residuals. A straight line drawn through a sigmoid systematically misses the shoulders. Low samples are called higher than they are, or lower, depending on which end you anchored. High samples are dragged toward the middle. The R-squared of that line can still look flattering because the middle points dominate. R-squared is not permission.
Declare the fit, then invert it. Report a concentration only when the signal lies between the lowest and highest standards that actually sit on the steep region you trust. If your lowest standard is already on the flat bottom, that standard does not define a lower limit of quantification. It defines a place where you can no longer tell concentrations apart. Say so.
Duplicates come next. Compute the concentration of each replicate separately, then look at how far those concentrations stand apart. Averaging the absorbances first and converting once hides the damage on the plateau. If the two concentrations disagree by more than the spread you accepted when you set the assay up, the well is not a result. Repeat it. Do not average a plateau pair into a false sense of precision.
| Curve shape | Likely cause | What to do next |
|---|---|---|
| Smooth sigmoid, sample on the steep limb | Ordinary binding saturation | Back-calculate inside the window you declared |
| Top flattens after only one or two standards | Antibody or substrate exhausted early, or reader at its ceiling | Shorten development, dilute the detection reagent, or confirm the instrument range |
| Top points fall instead of flattening | High-dose hook, especially in a one-step sandwich | Dilute those standards and see whether signal rises |
| Buffer curve and matrix curve diverge | Calibrator was prepared in the wrong matrix | Rebuild the curve in the sample matrix and check spike recovery |
| Straight line forced through a bend | The fit does not match the chemistry | Refit a logistic, or narrow the window until the limb is genuinely straight |
Failure modes that survive a pretty plot
A curve can be smooth and still be the wrong analyte. A cross-reactive antibody calibrates against a pure standard and then reports a related protein as the target. The shape will not save you. Specificity is an antibody experiment, argued before the fit.
A serial dilution that was mis-pipetted bends for arithmetic reasons. If each step is a bit short, the stated concentrations fan out from the truth and the inflection moves. Check the top standard independently, and build one curve from a fresh dilution rather than from the leftover row of a previous plate.
Subtracting a large blank and then fitting is another way to bend the truth. If the zero standard is already half the top standard, the dynamic range has collapsed. Fix the block and the washes. A subtracted curve of a noisy background reports the subtraction.
Software that silently switches from a logistic to a linear fit when a point is deleted will change every sample on the plate. Save the fit parameters with the raw file.
Safety around the reagents that build the curve
Calibrators are sometimes prepared from recombinant protein, sometimes from a purified native protein, and sometimes they arrive as a kit component with a preservative. Azide and other biocides are common. Acid stop solutions belong in the waste stream your institution names. The curve does not reduce that hazard. Nor does a careful fit turn a research immunoassay into a diagnostic test. Report the procedure, the fit and the window. Leave clinical decisions to methods validated for them.
A hot bench and a reader near its ceiling
Enzyme rate climbs with temperature. On a warm afternoon the substrate minutes that gave a steep limb in the morning can push the upper standards into the flat top, so the bend arrives early for a physical reason. Develop to a colour as well as to a clock, and keep plates you will compare inside the same temperature band. A ceiling absorbance on a mid-curve well means you are fitting the instrument, not the biology.
Humidity opens the edge of a drying plate and concentrates those standards. A curve built down one edge and samples built down the middle will not share a shape. Park the calibrators so evaporation cannot write a false slope. If a power cut interrupts a kinetic read, you do not have a curve. An endpoint colour that was already stopped can still be read. Record which of the two you were doing.
What to send when you ask about calibrators
State the analyte and its accession, the matrix, the concentration window you must resolve, and whether you already see a sigmoid, an early plateau, or a falling top. Say which fit you intend to use and whether the standards must be prepared in buffer or in sample matrix. The reagents and chemicals catalogue covers related reagent classes. The molecular biology pathway places the assay among other research methods. A curve and a calibrator class can be discussed through the quote request. Ask how the concentration of a calibrator is assigned and in what matrix it was defined. Do not treat a fitted line as a quantity the plate has already proved.
Questions from the bench
Why is a four-parameter logistic fit used so often?
Sandwich and competitive binding curves usually flatten at both ends and steepen in the middle, which is the shape a four-parameter logistic describes. The four numbers are a bottom, a top, an inflection and a slope. A straight line is the right fit only when you have already shown that the window you use is actually straight.
Can two wells with almost the same absorbance still hide different concentrations?
Yes, once both wells sit on the flat top or the flat bottom. There the curve barely moves when concentration changes a lot, so a small absorbance gap becomes a huge concentration gap after back-calculation. Agreement in colour at the plateau is not agreement in analyte.
What does back-calculation mean on a plate?
You invert the fitted curve. The reader gave you a signal, and the fit estimates which calibrator concentration would have produced that signal. The estimate is only as honest as the fit and only valid between the standards you included. Outside that span the inversion is an extrapolation, and you should not report it as a measured concentration.
Does a bent curve mean the assay failed?
A smooth sigmoid is the expected shape, not a failure. A bend that arrives too early, a top that sags, or a line that will not repeat on the next plate is the failure. Find out whether the cause is hook effect, spent substrate, a saturated reader, or a calibrator made in the wrong matrix before you change the biology.
References
Manufacturer names identify published method classes. Trademarks remain with their owners. Catalogue records on this site are independent references for enquiry. They are not a statement of inventory, distribution rights or a supply commitment. This page is educational. It is not medical advice, a diagnostic protocol or a biosafety approval.
Catalogue
Related products and categories
These links follow the subject of the article into published manufacturer references. A listing is a reference for an enquiry, not a statement of stock or distribution rights.
Continue in this cluster
Related reading
ELISA formats controls and readoutELISA formats, controls and readout: how direct, sandwich and competitive assays turn a binding event into a number that stays inside the curve. How laboratories estimate protein concentrationHow laboratories estimate protein concentration with absorbance, dye-binding and copper assays, and why the number depends on the standard.Hook effect and dilute-to-checkWhy a very high analyte can make a sandwich ELISA look low, and how a planned dilution series separates a hook effect from a truly low sample.